Grenoble is great
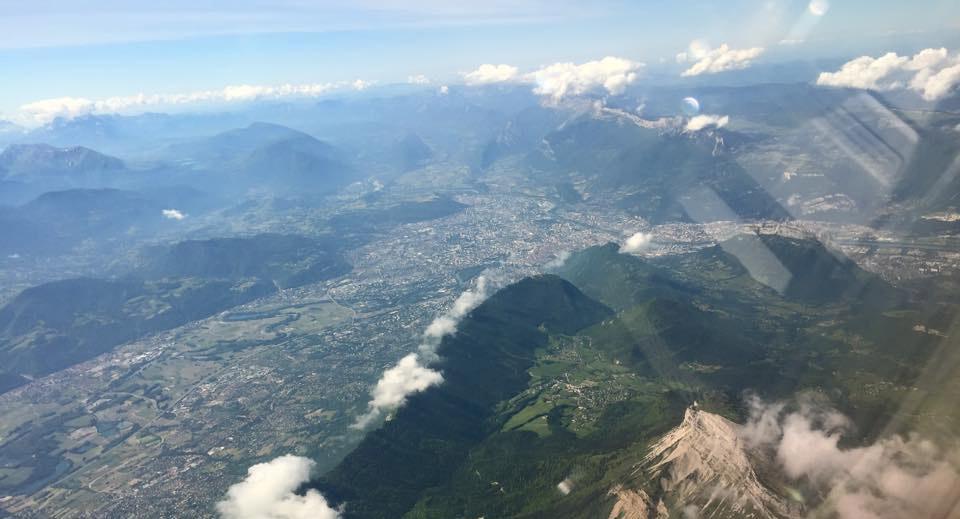
Have you ever been to Grenoble? It's a beautiful city in France, surrounded by mountains. I was a student in this city and I couldn't help but recognize its unique geography when I flew over it a few months ago.
There are lots of scientists and/or hiking lovers living there.
Transportation
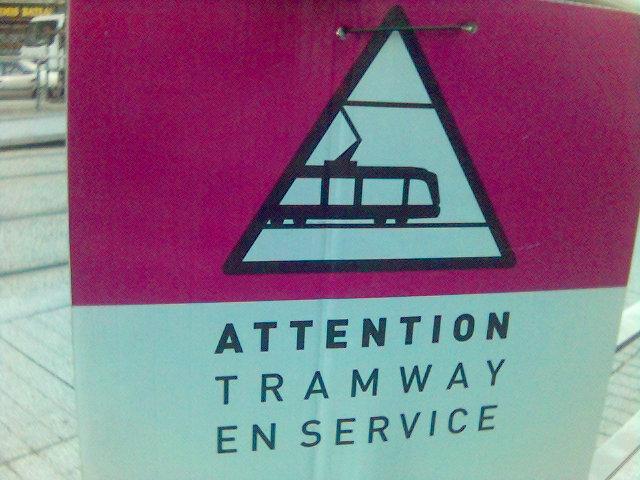
What about the transportation? Well, when I was living there, the public transportation company made a huge investment to convert a bus line into a tramway line. At the time, there were already two tram lines, namely A and B. They spent millions of euros to remove the bus line, and replace it by a new tramway line, you guessed it, the C line.
But... was it worth it?
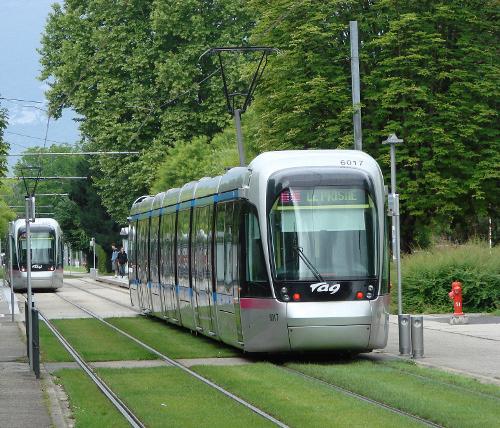
The B line and the new C line went to the campus. The public transport company claimed that:
- the B line had a frequency of 1 tramway every 5 minutes.
- the C line had a frequency of 1 tramway every 7 minutes.
The problem
So the C line was supposed to be just a little bit less frequent than the B line.
But almost every time I was waiting for the C line to go back home from the campus, I observed more than 2 B's passing by before a C comes. But the B line was not supposed to be twice as frequent! It looked like the public transport company was fooling us. That led me to the question :
What is the probability of observing the arrival of at least 2 B's before a C ?
We can figure it out with simple math.
The model
The arrival time is not deterministic, we only know the average arrival rate of each line. Let $\lambda_B$ be the arrival rate of the B line, and $\lambda_C$ the arrival rate of the C line. In our example, if the time is expressed in minutes, we have $\lambda_B = \frac{1}{5}$ and $\lambda_C = \frac{1}{7}$.
The company claims that $\lambda_B$ and $\lambda_C$ are constant (at least a big part of the day that includes when we made the observations) so we can assume a stationary increment property for the tramway arrival process.
We can modelize this as a Poisson process. I am not going to go into any details here, but all we need to know for now is that, if we note $N_t$ the number of B's that arrived at time $t$, the probability of observing $k$ tramways of the B line is given by :
$$ P ( N_t = k ) = \frac{(\lambda_b t)^k}{ k! } e^{-\lambda_b t} $$
It also implies that the waiting time for a C line, noted $T_C$, follows an exponential distribution :
$$ P( T_c \in [t; t+ dt] ) = \lambda_c e^{-\lambda_c t} dt $$
All we need to do after that is to plug these two distributions.
We want to count the times when at least two B's have already arrived by the time a C showed up. So we are interested in everything (probability = 1), except when there was 0 or 1 B-tramway, respectively $P ( N_{T_c} = 0 )$ and $P ( N_{T_c} = 1 )$.
So we are looking for :
$$ 1 - P ( N_{T_c} = 0 ) - P ( N_{T_c} = 1 ) $$
The only issue here is that the probability $P ( N_{T_c} = k )$ is itself a random variable, because we don't know the value of $T_c$.
We need to compute $P ( N_{T_c} = k )$ for every value $T_c$ can take, weighted by its probability. This is the expectation with respect to the random variable $T_c$. Let $P_k$ be this expectation :
$$ P_k = E [ P ( N_{T_c} = k ) ] $$
$P_k$ is the probability that the number of B's arrived before a C is equal to $k$.
So, "the probability of observing the arrival of at least 2 B's before a C" is given by :
$$ E [ P ( N_{T_c} \geq 2 )] = 1 - P_0 - P_1 $$
So, are they lying?
Let's compute $P_0$ and $P_1$.
$P_0$ is easily given by :
And $P_1$ :
Now we have all we need to compute the probability we want : $ E [ P ( N_{T_c} \geq 2 )] = 1 - P_0 - P_1 = \frac{\lambda_b^2}{(\lambda_b+\lambda_c)^2} $
Replacing $\lambda_B = \frac{1}{5}$ and $\lambda_C = \frac{1}{7}$, this gives us:
The answer : The probability of seeing more than 2 B's before a C coming is 34%
Hmm. That seems too low compared to what I observed. Let's go further.
The ugly truth
What we know for now is that we have observed many times an event that only has a 34% probability of happening. So it looks like the arrival rate of the brand new tramway line is much less than what they claim.
In order to see if they are really lying, we need to think in reverse: given our observation, what arrival rate is the most likely?
First, let's compute $P_k$.
To simplify the reading, let's note $\theta$ the ratio $ \lambda_c/\lambda_b $, so we finally have:
$$ P_k = \theta . (\frac{1}{1+\theta})^{k+1} $$
Let's go to the tram station every day, and note how many B's arrived before a C. We will note $M_i$ the value of the $i$-th observation. If we suppose each observation is independent, the probability to have this sequence of observation is:
Statisticians call this the likelihood function. Now we want to compute the $\theta$ that is most likely to give this sequence of observation, in other words, the $\theta$ that maximizes the likelihood function $\mathscr{L}$. Let's call it $ \widehat{\theta}$. Instead of maximizing the likelihood function, we can maximize its $log$, since $log$ is increasing.
I counted how many B’s arrived before a C and got this :
[ 2 , 3 , 1 , 0 , 4 , 2 , 1 , 3 , 2 , 3 , 2 , 4 , 0 , 3]
The average is about 2.14. If $\lambda_b = \frac{1}{5}$ is fixed, this means: $\lambda_c \simeq \frac{1}{10.7} \text{min}^{-1} $
The line C has an arrival rate of one every 10 minutes 42 seconds, and not one every 7 minutes as claimed.
What now?
Nothing. What could I have done instead of all this calculus? (Except "getting a life"... {audience laughing})
I could have waited to measure the waiting time for each tramway line independently. What I measured below gives us the ratio of the arrival rates, and the ratio only gives us, well, the ratio. It could be simply true that C has 7 minutes expected waiting time as claimed, and B has only $\frac{7}{2.14} \simeq 3 \text{ min } 16 \text{ sec }$.
But this method is still interesting because it allows you to have an information about duration:
- without using a chronometer.
- without skipping a C line. In another setting this can be particularly interesting if observing the event related to $\lambda_c$ is costly (eg crash test).
In my case, it prevented from waiting for a while at the station, and allowed me to come back home and work on a heart broken compiler. But that's another story. Stay tuned.